StockTool: A Minimal Portfolio Visualizer Built from First Principles
Part 1 of 2
StockTool started out of frustration. Most portfolio trackers are either overloaded dashboards with subscription walls or bare spreadsheets with little insight. Neither reflects how many people actually think about their investments.
The experiment was simple: build a minimal tool that represents a portfolio the way a human mentally models it — as a hierarchy of strategies, groups, and positions.
The Core Idea
Instead of a flat table of holdings, the portfolio is represented as a nested tree:
- Portfolios at the top level
- Groups for strategies, sectors, or themes
- Stocks as leaf nodes
- Positions as transactions within each stock
- Watchlists for non-owned assets
This structure mirrors how decisions are made, not how data is typically stored.
Why Build Another Tool?
Existing solutions often force users into predefined workflows:
- Complex interfaces designed for every use case
- Limited customization despite feature bloat
- Heavy reliance on cloud services
- Poor support for long-term historical context
- Mobile-first designs that sacrifice clarity
A lightweight, local tool can prioritize clarity over completeness.
What Exists So Far
- Functional tree view with expand/collapse
- Drag-and-drop reordering and nesting
- Validation to prevent illegal moves
- Position tracking per stock
- Aggregated values for groups and portfolios
- Basic alerts with thresholds
- Details panel for editing selected nodes
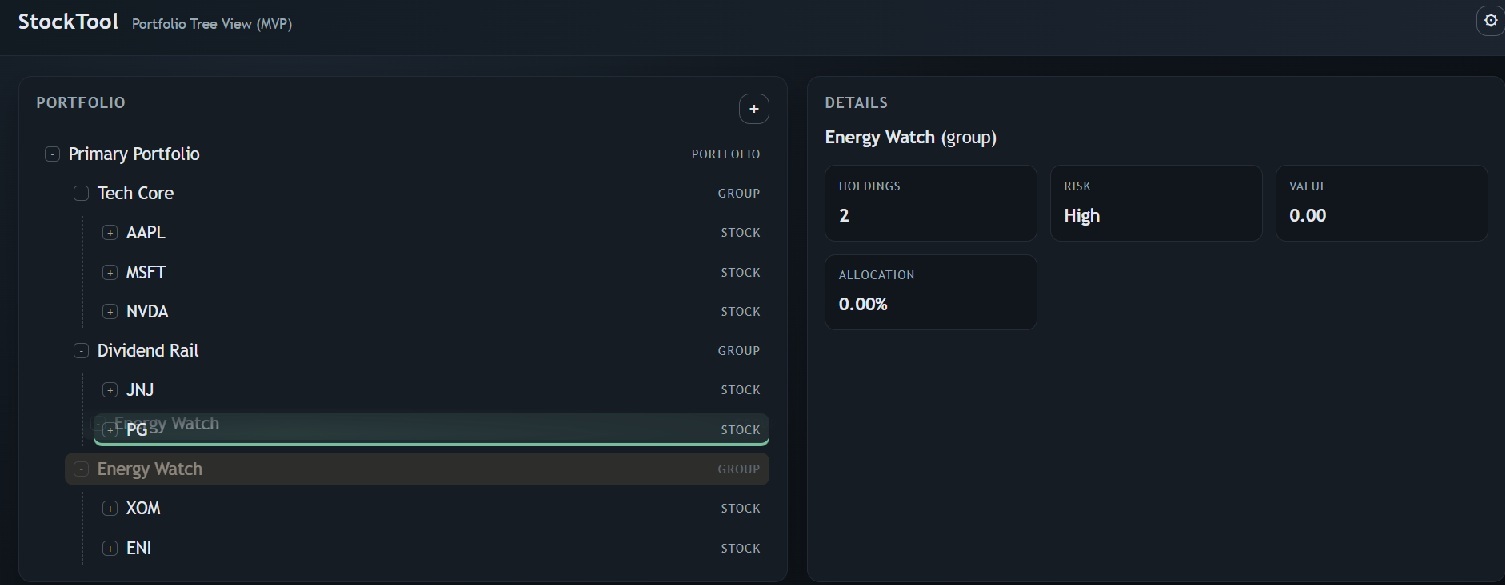 Early WIP prototype: functional tree portfolio structure with grouping and nesting, establishing the interaction model before persistence and analytics.
All implemented using plain HTML, CSS, and JavaScript.
UI as the Primary Innovation
Tree-Based Portfolio Model
A hierarchical view allows grouping by anything meaningful: risk profile, strategy, sector, time horizon, or personal categories. This enables both overview and drill-down without switching views.
Drag-and-Drop Organization
Reorganizing a portfolio should feel like rearranging folders, not editing database rows. Direct manipulation makes structure changes immediate and intuitive.
Heat Drivers Concept
Alerts can influence visual emphasis, highlighting positions that require attention. Instead of scanning tables, the user can quickly see what matters right now.
Contextual Details Panel
Selecting any node reveals relevant actions and statistics without navigating away from the main structure. This reduces mode switching and keeps focus on the portfolio as a whole.
Design Philosophy
- No frameworks
- No external dependencies
- Fully local operation
- Readable codebase
- Incremental feature growth
The goal is not to compete with professional platforms, but to explore whether a simpler model can be more usable.
Limitations
- No persistent storage yet
- No real-time market data integration
- No advanced analytics
- Limited performance optimization
However, the structural foundation is already in place.
Why This Matters
Sometimes innovation comes from rethinking representation rather than adding functionality. A tool that matches mental models can be more useful than one with hundreds of features. This experiment tests whether a hierarchy-first approach can make portfolio management more intuitive.
Takeaways
- Data representation strongly influences usability
- Direct manipulation often beats form-based editing
- Minimal tools can expose new interaction patterns
- Local-first design reduces friction and dependency
Next
Planned milestones include statistics aggregation, visualization modes, chart integration, and persistent storage — building on the existing tree architecture.